Admin Console
The Admin Console is the central hub for managing your Priset account, monitoring usage, and configuring settings. Upon logging in, you are greeted with the main dashboard. You can use the buttons on this dashboard to navigate to other areas of the Admin Console.
Header Area
In the header area you can find the following:
- Logo: Located at the top left.
- Welcome Message: Displays a personalized welcome message.
Sidebar Navigation
The sidebar provides access to the main administrative areas:
- Dashboard: The main overview screen (shown below).
- Usage: Detailed usage analytics.
- Users: Invite new users, manage roles, and deactivate accounts.
- Billing: Manage your plan, view invoices, and update payment details.
- Teams: Team management. This functionality is exclusive to accounts with the "Teams" subscription.
- Model Configuration: Choose the AI Provider and supply your AI Key (BYOK). You can configure multiple providers.
- View Support Tickets: Access to your support history with an action button to raise technical issues.
- Contact Us: Opens up a contact form that should be used for general inquiries and questions not related to technical help.
- Installation: Link to the installation instructions.
- Documentation: Link to the documentation site.
- User/Account Menu (at the bottom): Allows access to profile settings and logout.
Main Dashboard
The Main Dashboard provides a quick snapshot of your organization's status and usage as well as quick access to support and resources.
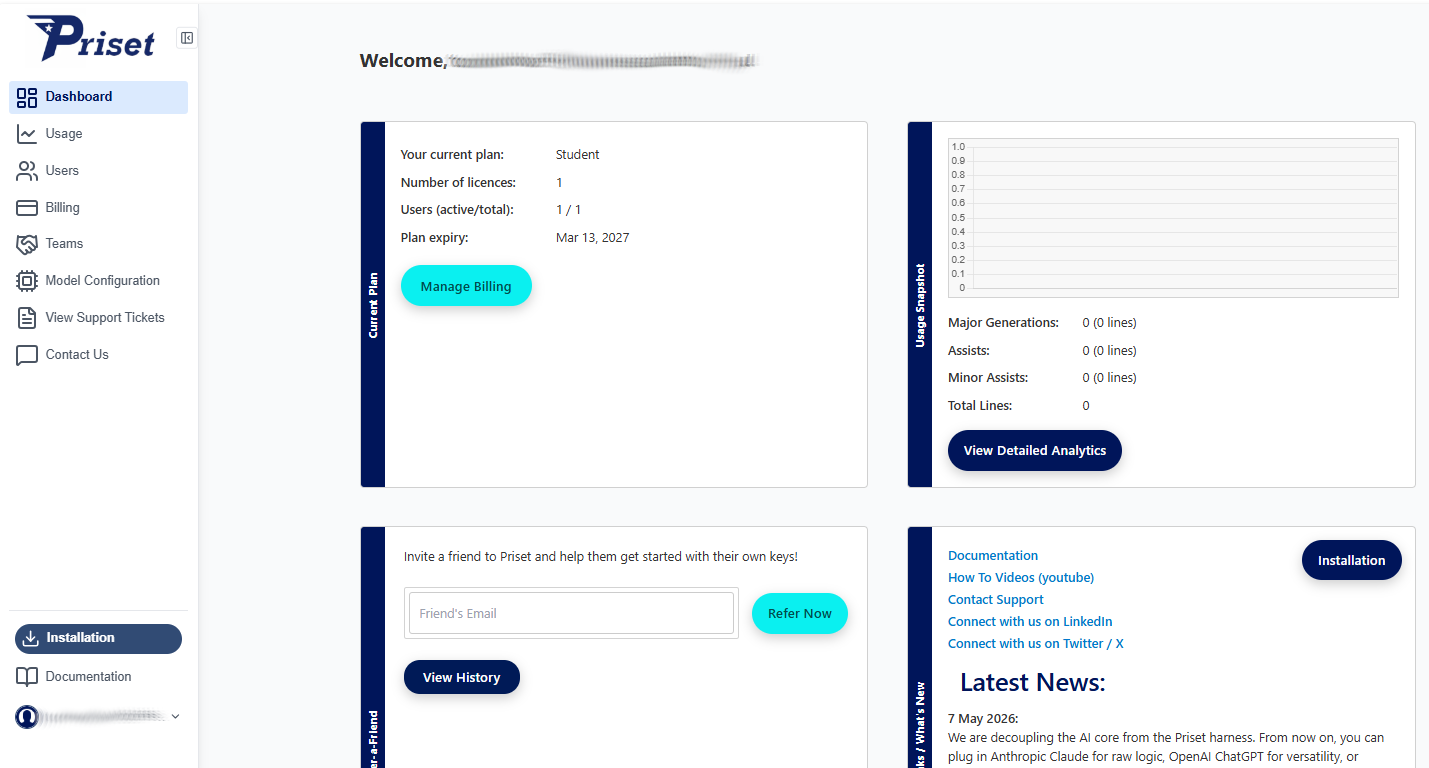
The main dashboard area is divided into four key sections. Top two relate to your current plan while the bottom two contain useful links and information as well as the referral panel.
1. Current Plan
This tile displays the details of your current subscription.
- Current plan: Shows the active plan (e.g., Pro).
- Number of licences: Indicates the total number of licenses available (e.g., 1).
- Users (active/total): Usage of seats. Shows the count of active users versus the total users that accepted the invitation (e.g., 1 / 1).
- Plan expiry: Displays the date when the current plan expires. Subscription should be renewed prior to the expiration date (e.g., Oct 23, 2026).
- Available credit: Shows the remaining credits in your account (e.g., 7770).
- Manage Billing: Update payment methods or change plans. This button navigates to the Billing page.
- View Features: See what's included in your current plan.
2. Usage Snapshot
This tile provides a visual and numerical summary of your AI usage.
- Bar Chart: Visual representation of usage over time.
- Major Generations: Count of complex generations (e.g., where more than 70 credits are spent).
- Assists: Count of standard AI assists (e.g., where credits spent is a value betwen 15 and 69).
- Minor Assists: Count of small completions (e.g., where less than 15 credits are spent).
- View Detailed Analytics: Drill down into usage reports. This button opens the Usage page (See below for more etails).
3. Refer-a-Friend
This tile allows you to invite others to the platform.
- Input Field: Field to enter a friend's email address.
- Refer Now: Send the invitation email to your firend's email address.
- View History: See the list of past referrals and what is their onboarding stage.
4. Quick Links / What's New
This tile offers direct access to helpful resources and the latest updates.
-
Quick Links:
- Documentation (this site)
- How To Videos (youtube)
- Contact Support
- Connect with us on LinkedIn
- Connect with us on Twitter / X
- Installation button.
-
Latest News: Updates from the Priset team.
- Example: "18 Mar 2026: Priset Architect Mode and Q&A Mode have been released. Check out how these enable the Glass Box Pair Programming."
- Installation: Opens up the documentation page that explains how to install Priset in your favorite IDE.
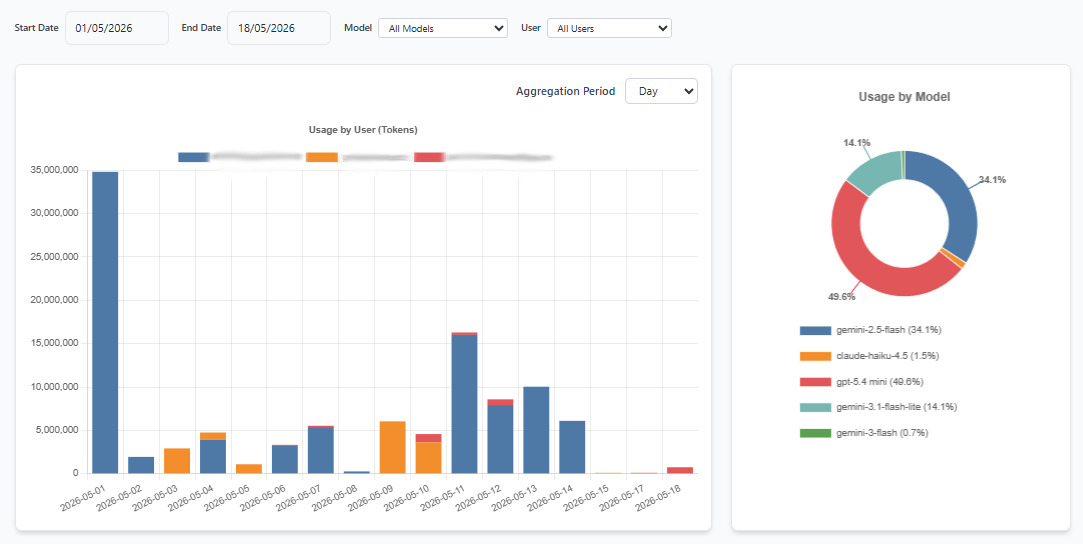
Usage Dashboard
After you click on the View Detailed Analytics button on the Main dashboard or Usage navigation item, the Usage page will be shown. The top of the page features the Usage charts (shown below), below which is the table containing detailed statistics about token and credit usage (e.g. listing users, dates, model used as well as tokens and credit consumed). Note that credit consumption is available only for the legacy plans.
Usage data can be exported to CSV file by clicking on the Export CSV button. The exported file will apply all current filter settings, ensuring that only the displayed data is captured.
You can filter the chart and table data by selecting specific time ranges, users and models.